 The market certainly has seen it’s share of volatility in the last 5 years. From 2007 when banks started clamping down, canceling deals in progress and short sales and foreclosures beginning to emerge in earnest, we’ve seen our share of ups and downs. Though many think it was, it wasn’t a straight drop. For those waiting for the “bottom” of the market, can you see it in the chart below?
The charts below are for Central Contra Costa, specifically Walnut Creek, Pleasant Hill, Concord, Clayton and Martinez. Take a look, it is an interesting look back at our crazy roller coaster ride.
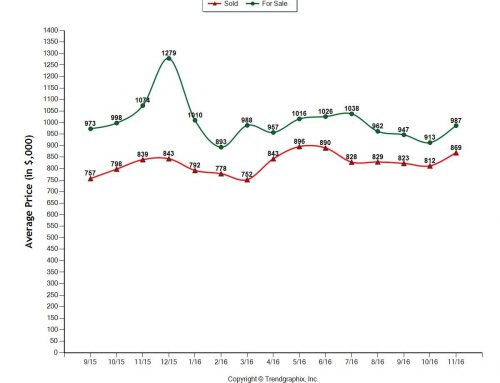
Just note some of these amazing numbers, and LOOK at our inventory levels now as compared to 5 years ago. From 5 years ago pending sales are UP 92%, number of homes on the market is DOWN 62%, and the number of sold homes are UP 25%. What about home prices here in Central Contra Costa during the same 5 year timeframe? The average active home on market pricing has dipped 17.4%, and the average sold home price has dipped 51.5%. Does any of this surprise you?
Here are the charts.
Central Contra Costa County Housing Inventory (Active, Pending, Sold)
(Walnut Creek, Pleasant Hill, Concord, Clayton, Martinez)
Central Contra Costa County Housing Pricing Trends last 5 years (average price for sale vs. sold)
(Walnut Creek, Pleasant Hill, Concord, Clayton, Martinez)
Central Contra Costa Housing Inventory Levels (last 5 years)
(Walnut Creek, Pleasant Hill, Concord, Clayton, Martinez)


Leave A Comment
You must be logged in to post a comment.