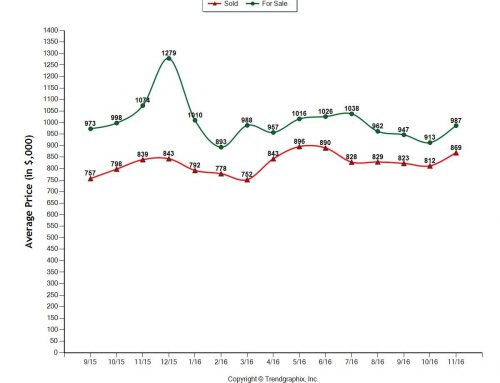
Contra Costa Housing Affordability declines
Check out the latest release from the California Association of Realtors. Their research shows that from 2nd quarter last year, to 2nd quarter this year, housing affordability in California overall is down 15% – from 51% in 2012 to 36% in 2013.
In the Bay Area and Contra Costa Housing Affordability, the numbers look like this:
| C.A.R. Region | Housing Affordability Index | Median Home Price | Monthly Payment Including Taxes & Insurance | Minimum Qualifying Income |
| Calif. Single-family home | 36 | $415,770 | $2,000 | $79,910 |
| Calif. Condo/Townhome | 46 | $334,160 | $1,610 | $64,230 |
| Los Angeles Metro Area | 39 | $380,890 | $1,830 | $73,210 |
| Inland Empire | 56 | $239,640 | $1,150 | $46,060 |
| San Francisco Bay Area | 24 | $706,340 | $3,390 | $135,760 |
| United States | 60 | $203,500 | $980 | $39,110 |
| San Francisco Bay Area | ||||
| Alameda | 25 | $640,020 | $3,080 | $123,020 |
| Contra-Costa (Central Cty) | 20 | $796,150 | $3,830 | $153,030 |
| Marin | 20 | $972,440 | $4,670 | $186,910 |
| Napa | 34 | $481,820 | $2,320 | $92,610 |
| San Francisco | 17 | $902,420 | $4,340 | $173,450 |
| San Mateo | 17 | $960,000 | $4,610 | $184,520 |
| Santa Clara | 24 | $808,500 | $3,880 | $155,400 |
| Solano | 63 | $265,900 | $1,280 | $51,110 |
| Sonoma | 29 | $442,710 | $2,130 | $85,090 |
Chart: CAR releases Q2 Affordability Index
Read the whole report at this link Contra Costa Housing Affordability
What is the Contra Costa median home price? What’s the Contra Costa monthly payment and income required for the median home price? The link, the chart, tells you all the information you may need.
If you want to buy or sell a home in Contra Costa, contact Catherine Myers at 925-683-2125.


